Intro

I'm passionate about transforming raw numbers into meaningful insights that drive informed decisions. With a strong background in Economics and Data Analytics, I specialize in collecting, cleaning, and interpreting data to uncover patterns and support strategic planning,
Known as “Babs the Data Magician” I blend analytical precision with creative problem solving, turning complex datasets into clear, actionable insights that help organizations make smarter decisions, check out my awesome project.
Global Layoffs Data Cleaning
and Exploratory Data Analysis
Completed: June 2025
SQL
Data Analysis
Data Cleaning
This project demonstrates the use of Structured Query Language(SQL) for end-to-end data cleaning, transformation, and exploratory data analysis (EDA) on a global layoffs dataset. The process involved identifying and removing duplicates, handling missing values, standardizing inconsistent entries, and converting data types to ensure analytical accuracy.
Through advanced SQL queries including aggregations, window functions, and CTEs, the analysis uncovered workforce reduction trends across industries, countries, and company stages, highlighting the most impacted sectors and time periods. The results provide actionable insights into global employment patterns and demonstrate strong proficiency in data wrangling, descriptive analytics, and SQL based business insight generation.
Northwind Sales Performance
Analysis Report
Completed: May 2025
Power BI
Data Visualization
Business Intelligence
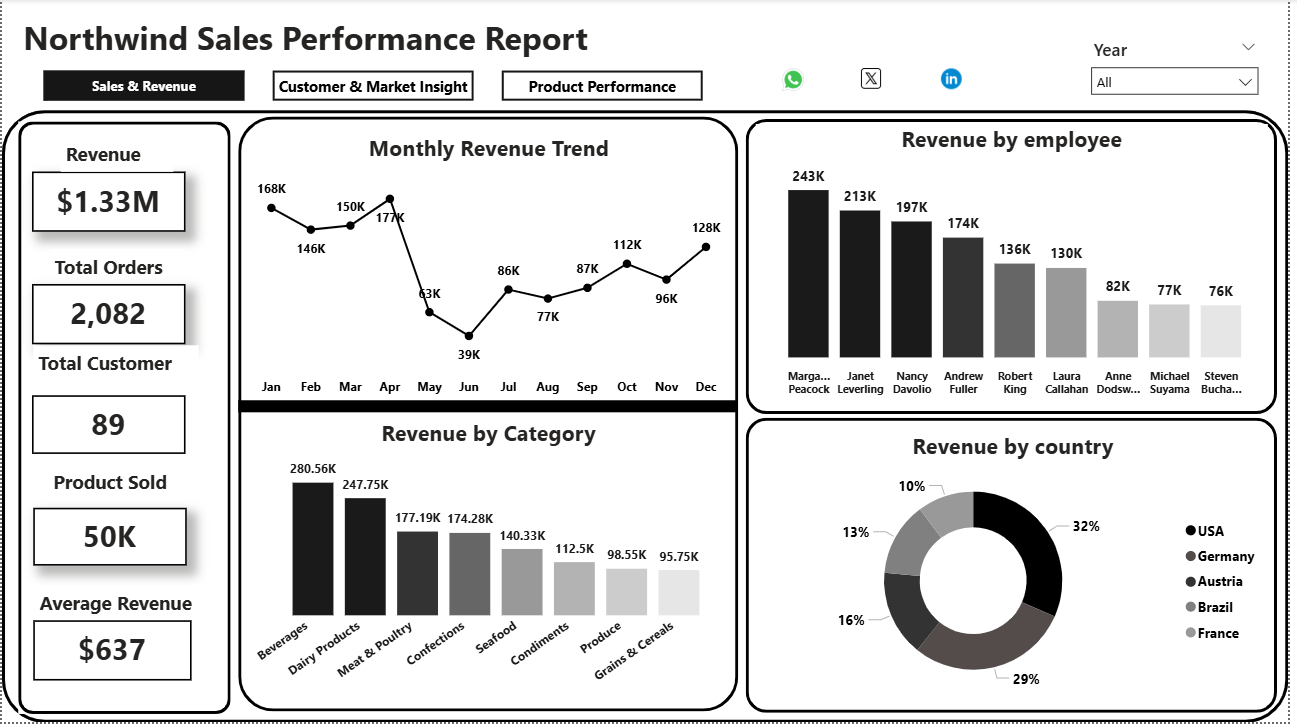
The Northwind Sales Performance Analysis project focuses on uncovering key business insights from the classic Northwind dataset. It aims to evaluate sales trends, customer behavior, product performance, and employee contributions to overall revenue.
Using Power BI, the project transforms raw transactional data into an interactive and visually engaging dashboard, empowering stakeholders to make data-driven business decisions.
Comprehensive Data Analytics
Capstone Project(Excel,
Power BI, SQL & Python)
Completed: September 2025
Excel, Power BI, SQL and Python.
Data cleaning and Visualization
Business Intelligence
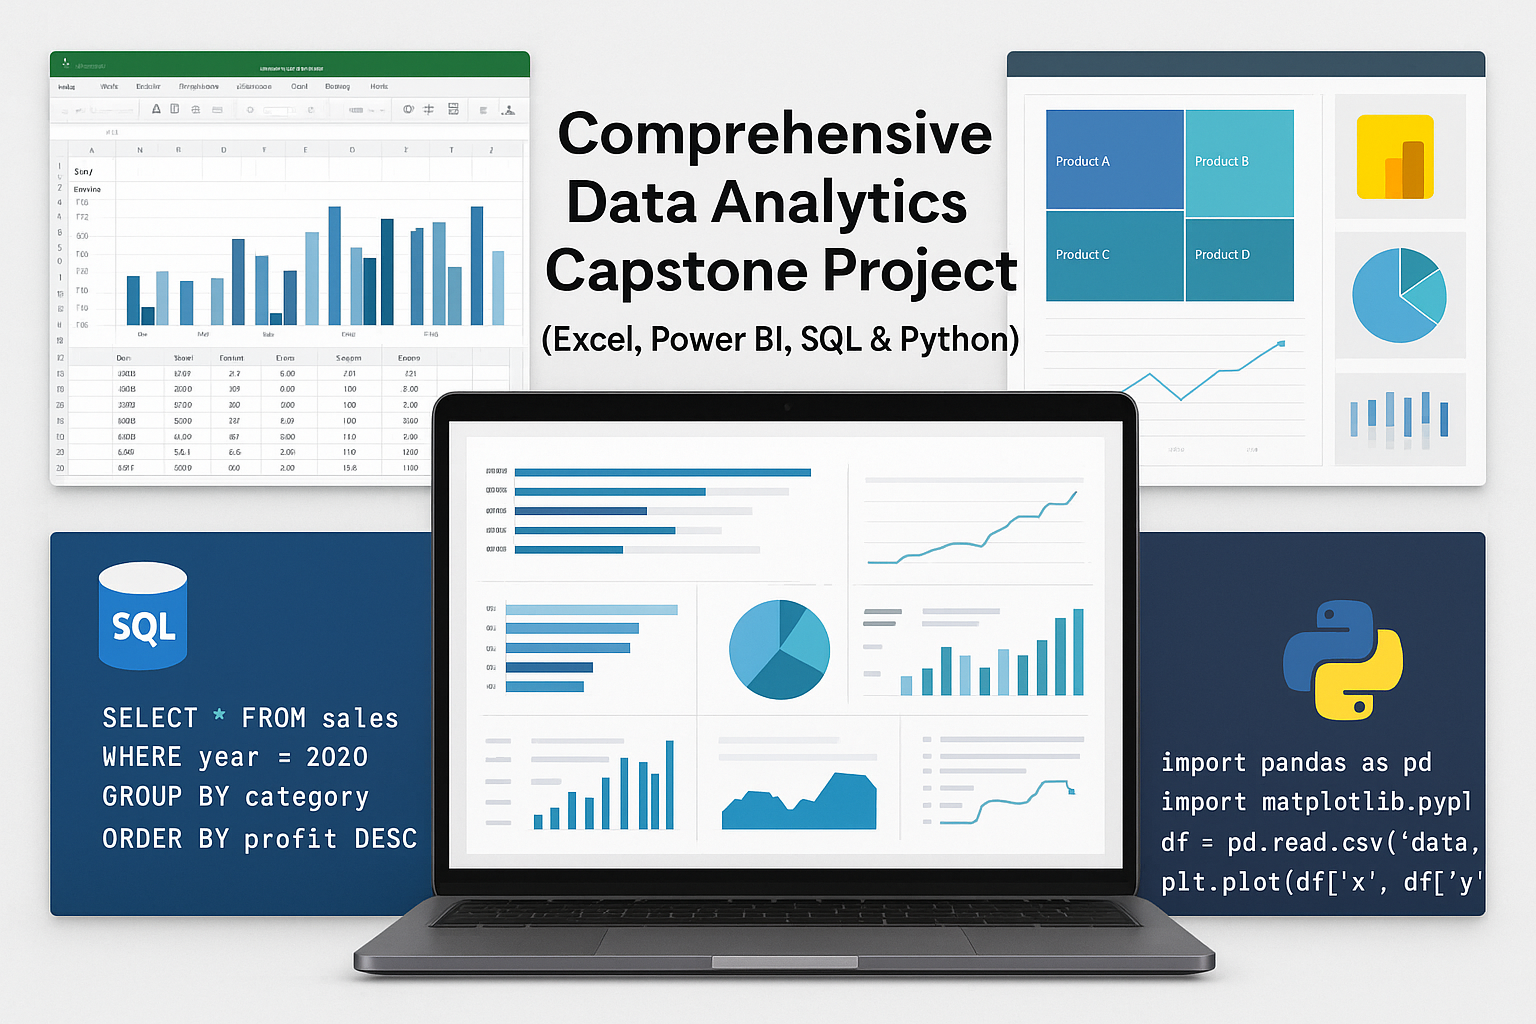
This capstone project demonstrates end-to-end proficiency in data analytics using Microsoft Excel, Power BI, SQL, and Python. Each project showcases practical data analysis skills — from cleaning and transformation to visualization and insight generation — applied to real-world business datasets.
Using Power BI, the project transforms raw transactional data into an interactive and visually engaging dashboard, empowering stakeholders to make data-driven business decisions.
Project Overview
- 1. Excel Data Cleaning Report
Cleaned and standardized a raw retail dataset by removing duplicates, handling blanks, correcting inconsistent entries, and formatting data for accurate analysis. The final dataset was validated for structure and consistency, demonstrating mastery of Excel’s core data preparation tools.
- 2. Power BI - Digital Marketing Campaign Analysis
Developed an interactive Power BI dashboard to evaluate marketing performance across multiple channels (Email, Instagram Ads, Google Ads, etc.). The dashboard visualized key metrics such as ad spend, impressions, clicks, conversions, and ROI. Insights guided budget reallocation toward high-performing channels like Influencer and Instagram marketing.
- 3. SQL - Retail Sales Analysis
Created and analyzed a retail sales database using SQL. Conducted data cleaning, exploratory data analysis (EDA), and generated insights into customer demographics, product performance, seasonal sales patterns, and transaction behavior. Provided actionable business recommendations on category focus, customer targeting, and operational optimization.
- 4. Python - Retail Sales Performance Analysis
Applied Python (Pandas, Matplotlib, Seaborn) for exploratory analysis and visualization of retail data. Identified top-performing products (Burgers by revenue, Beverages by volume), leading managers (Joao Silva, Lisbon), and seasonal demand trends (December peak). Delivered data-driven recommendations on product bundling, regional strategy, and demand forecasting.
Chelsea's Mega Store Sales
Performance Dashboard
Completed: March 2025
Excel and Power Query
Data cleaning and Visualization
Business Intelligence
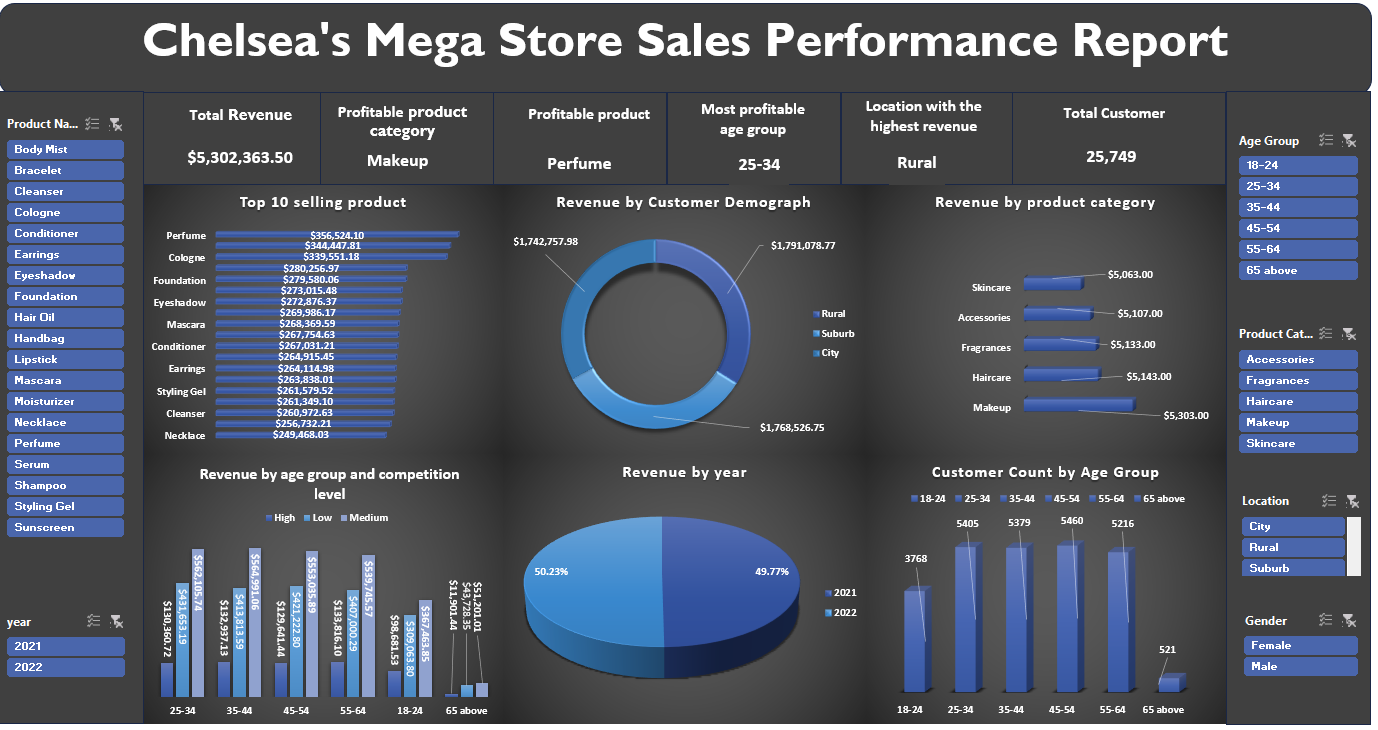
This project involves analyzing two years of sales data from Chelsea’s Mega Store, a retail and personal care business. Using Microsoft Excel, I created an interactive dashboard that tracks key performance metrics, including total revenue, top 10 selling products, customer demographics, product category performance, and yearly revenue distribution.
The analysis revealed that Makeup and Fragrances are the store’s most profitable categories, while Perfume and Cologne rank as the highest-selling products. The 25–34 age group generated the highest revenue across all customer segments, and Rural locations contributed the largest share of total sales.
Through data cleaning, formula-based calculations, pivot tables, and advanced Excel visualization techniques, this dashboard provides clear insights to support decision-making around product strategy, customer targeting, and revenue optimization.
STUDENTS PERFORMANCE ANALYSIS
REPORT
Completed: JULY 2025
Power-BI, Power Query and DAX
Data cleaning and Visualization
Descriptive & Diagnostic Educational Performance Analysis.
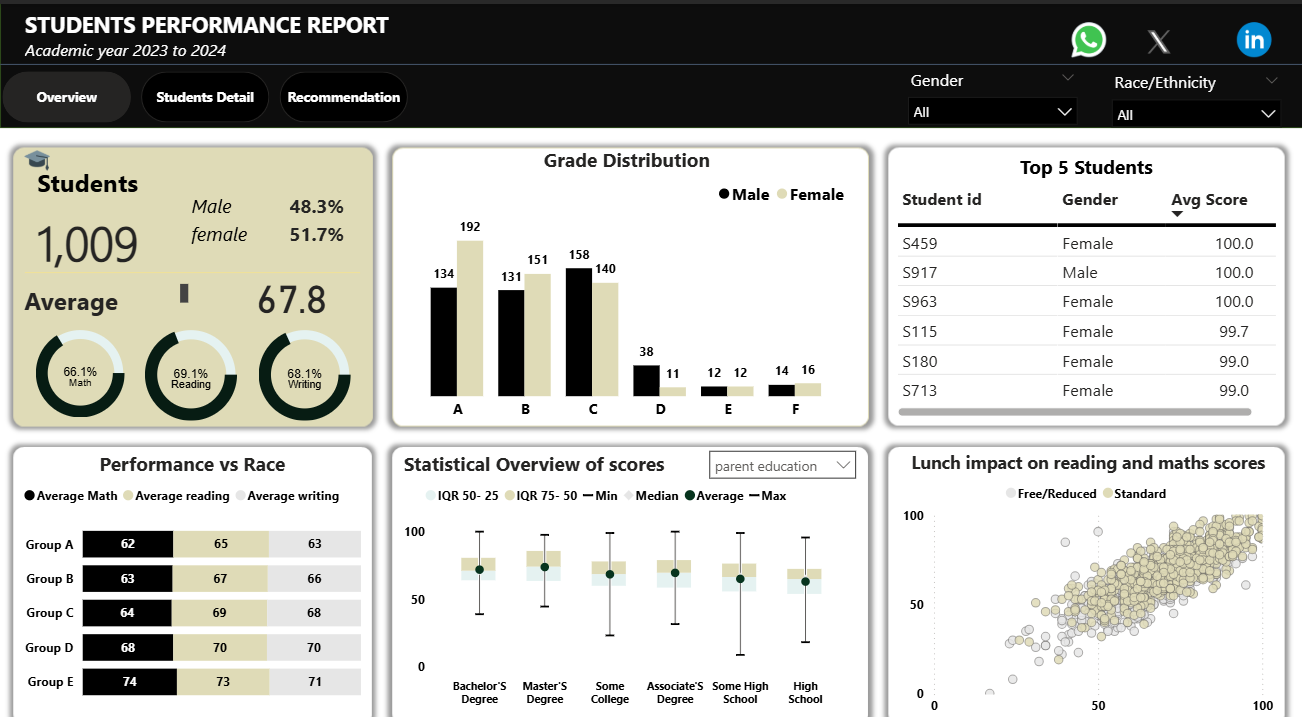
The Students Performance Analysis Dashboard is an end-to-end data analytics project designed to evaluate academic outcomes for 1,009 students during the 2023–2024 academic year. Built entirely in Microsoft Excel, the project leverages advanced data-cleaning techniques, KPI metrics, statistical analysis, and interactive visualizations to uncover the key factors influencing student achievement.
This analysis provides a comprehensive examination of students’ Math, Reading, and Writing performance while exploring how demographic variables—such as gender, race/ethnicity, parental education level, socio-economic status (lunch type), and test preparation participation affect academic results.
Forensic Data Analysis:
the Killer of Roland Greene
Completed: OCTOBER 2025
Using SQL
Forensic Data Analysis / Investigative Data Analysis.
This project applies advanced SQL based investigative analysis to solve a simulated forensic case involving the death of Roland Greene, a renowned art collector found dead in the Vault Room at 8:00 PM during a private estate auction. Although all guests provided alibis, discrepancies in movement patterns and access logs indicated that one or more suspects were lying.
Using multiple datasets including the suspects list, door access logs, call records, and forensic timeline. I performed a comprehensive SQL analysis to examine room access patterns, validate or disprove alibis, and identify individuals present near restricted areas during the critical time window. By leveraging SQL joins, filters, logical operators, and timestamp comparisons, the investigation successfully narrowed down the individuals whose movements conflict with their alibi statements.
The analysis revealed several suspects who accessed sensitive rooms between 19:56 and 20:01, the estimated time of death. Among them, a small group stood out due to a combination of false alibis, suspicious room entries, and motive-related roles or relationships. These insights led to the identification of the primary suspects, with one individual emerging as the most likely perpetrator.
This project demonstrates strong analytical reasoning, SQL proficiency, and the ability to transform raw data into meaningful investigative insights reflecting how data analysis can support forensic decision-making and real-world problem-solving.
About

As an Economist and Data Analyst with an emerging interest in backend development, I bring a unique perspective to data-driven problem solving. My economics background provides a strong foundation in understanding market dynamics and financial systems, while my analytical skills enable me to transform complex data into actionable business insights.
My approach combines rigorous statistical analysis with clear communication, ensuring that technical findings are translated into business-friendly recommendations. Whether it's conducting market analysis, optimizing business processes, or developing data-driven solutions, I'm committed to delivering results that drive organizational success.
Skills
- Problem Solving
- Data Entry
- Communication
- Analytical Thinking
- Requirement Gathering
Technical Tools
Areas of Interest
- Data Analysis
- Financial Analysis
- Econometrics
- Storytelling with Data
- Backend Development
Currently, I'm expanding my expertise into backend development, aiming to bridge the gap between data analysis and software engineering. This combination of skills positions me uniquely to contribute to both analytical and technical aspects of data-driven projects.
I'm always eager to take on new challenges and collaborate on projects that require analytical rigor and creative problem-solving. Let's connect and discuss how I can contribute to your organization's success.
Contact
Elements
Text
This is bold and this is strong. This is italic and this is emphasized.
This is superscript text and this is subscript text.
This is underlined and this is code: for (;;) { ... }. Finally, this is a link.
Heading Level 2
Heading Level 3
Heading Level 4
Heading Level 5
Heading Level 6
Blockquote
Fringilla nisl. Donec accumsan interdum nisi, quis tincidunt felis sagittis eget tempus euismod. Vestibulum ante ipsum primis in faucibus vestibulum. Blandit adipiscing eu felis iaculis volutpat ac adipiscing accumsan faucibus. Vestibulum ante ipsum primis in faucibus lorem ipsum dolor sit amet nullam adipiscing eu felis.
Preformatted
i = 0;

while (!deck.isInOrder()) {
    print 'Iteration ' + i;
    deck.shuffle();
    i++;
}

print 'It took ' + i + ' iterations to sort the deck.';
Lists
Unordered
- Dolor pulvinar etiam.
- Sagittis adipiscing.
- Felis enim feugiat.
Alternate
- Dolor pulvinar etiam.
- Sagittis adipiscing.
- Felis enim feugiat.
Ordered
- Dolor pulvinar etiam.
- Etiam vel felis viverra.
- Felis enim feugiat.
- Dolor pulvinar etiam.
- Etiam vel felis lorem.
- Felis enim et feugiat.
Icons
Actions
Table
Default
| Name |
Description |
Price |
| Item One |
Ante turpis integer aliquet porttitor. |
29.99 |
| Item Two |
Vis ac commodo adipiscing arcu aliquet. |
19.99 |
| Item Three |
Morbi faucibus arcu accumsan lorem. |
29.99 |
| Item Four |
Vitae integer tempus condimentum. |
19.99 |
| Item Five |
Ante turpis integer aliquet porttitor. |
29.99 |
|
100.00 |
Alternate
| Name |
Description |
Price |
| Item One |
Ante turpis integer aliquet porttitor. |
29.99 |
| Item Two |
Vis ac commodo adipiscing arcu aliquet. |
19.99 |
| Item Three |
Morbi faucibus arcu accumsan lorem. |
29.99 |
| Item Four |
Vitae integer tempus condimentum. |
19.99 |
| Item Five |
Ante turpis integer aliquet porttitor. |
29.99 |
|
100.00 |